In the past, if you wanted to know how a machine was performing on a shop floor, you would have had to put pencil to paper and note the output, the error rate, the quality, all manually. You would have to look at the quality of the inputs and the available supply of the raw materials. You would have had to look at the output over time to see if there was a consistency to quality, or errors, that needed to be investigated.
In other words, you were looking at potentially weeks of manual effort to figure out why and how a manufacturing process was going awry. That, in and of itself, isn’t a good use of anyone’s time and is a pretty inefficient way to become more profitable.
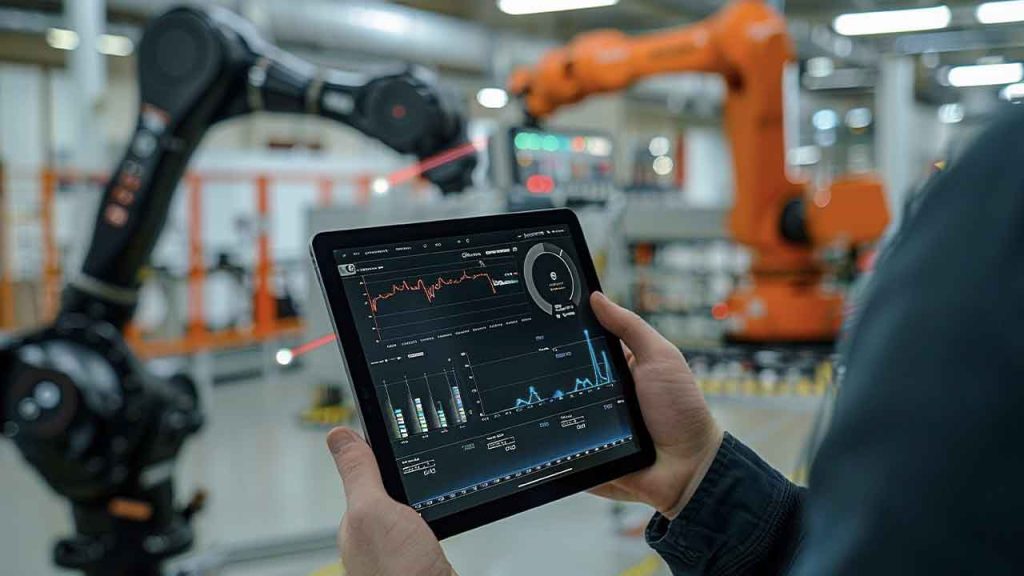
Then came Industrial IoT and the ability to monitor machines directly, providing quantities of data from the machine, as well as the operator, that can be analyzed in order to improve both production and quality.
What are manufacturing analytics?
Analytics are essentially the collection and manipulation of large quantities of data to reveal insights. Data about the performance of machines and people, going through the process of receiving an order through delivery of that order, is collected and reformatted as easy to understand metrics, to reveal where there are issues with performance or output quality.
This goes beyond the actual collection of the data to include the formulation of insights that can be used at every level of the organization. The advancement of tools and software in this area means that the process of collecting data is no longer manual and the analysis is centrally available, in real time, for everyone from the shop floor manager to the CEO to review and act on.
More about Top Use Cases for Manufacturing Analytics
What are the advantages of leveraging manufacturing analytics?
There are many advantages to leveraging real time business intelligence:
- Customer satisfaction—With the ability to discover performance and / or quality control issues in any one order before they become problematic, the net result is better customer satisfaction.
- Availability of real time data—Rather than waiting for a problem, the availability of real time data that is formatted into metrics and insights constructed for specific users, a problem with a machine can be proactively discovered, even predicted based on historical data and current usage.
- Reduction in errors—Less scraps, less errors and early discovery of errors or reduction in quality long before too much of a production cycle has expired mean less cost to the manufacturer.
- Reduction in unplanned downtime—The real time data also allows operators to get an immediate view of performance of any given machine; a minute lag in production or quality can be picked up and preventive maintenance planned for a time that will not affect any order cycles. Instead of operators existing in reactive mode, they’ll be able to be proactive in handling the maintenance of machines. Eventually, artificial intelligence applications will allow machines to basically fix themselves.
- Breaking down costs—If a machine only produced one of whatever it was producing in a cycle, the cost per unit would be simple to evaluate and the cost of an error or reduction in performance would be minimal. When a machine produces thousands of units, the cost of having flawed raw resources at the outset could be extraordinarily expensive because while the unit cost might be small, multiplied by several thousand and it suddenly becomes a major problem.
“Increased revenue (33.1%), increased customer satisfaction (22.1%) and increased product quality (11%) are the top three benefits of Industrial Analytics.” (Source)
How data on production and quality combine to create useful analytics
Production and quality are interrelated. A gain in one that results in a loss in the other is not moving the manufacturing process, or its associated costs, forward. In the past, data on performance was often looked at separately from quality. Whether a machine—or its operator—were lagging during the overnight shift set up on a big order was seen as distinct from the quality of the output.
The theory being that the customer would be okay with a longer production time on their order as long as the quality was there. But that’s no longer the case. Customers the world over are expecting more and rightfully so. To achieve a better level of satisfaction, the data on performance AND quality must be combined to achieve industry or organizational level markers. These metrics are the difference between keeping a client happy and simply keeping them.
Going from descriptive to predictive analytics
“69% of decision makers believe Industrial Analytics will be crucial for business success in 2020, with 15% considering it crucial today.” (Source)
The bottom line in manufacturing analytics is to go beyond the simple collection and display of data (descriptive) to leveraging it at a more granular level to be able to predict issues on the shop floor, and save money while improving output, in the process. Taking historical data, for example, and estimating what isn’t known, such as future demand, the statistical possibility of machine failure and so on will help everyone from the operator on the shop floor to the higher level decision makers to see where production is at or likely to be, at any given moment. Of course, as with any prediction or estimate, there is no guarantee of accuracy, but it’s far more likely to be valid when enough data is used to support the analytics, than a human prediction.
 This article was written by Graham Immerman, Director of Marketing for MachineMetrics, a venture-backed manufacturing analytics platform. Graham has quickly become an authority on digital transformation and the application of IIoT technology for the manufacturing industry. Originally the article was published here.