Manufacturers today face a critical gap: factories are full of dashboards showing vibration graphs, torque curves, and temperature plots, yet critical equipment still fails unexpectedly. Experts from InfluxData, CGI, Bosch, and Trask identify the fix: moving from reactive alarms to predictive signals built on industrial-grade time-series database infrastructure.
That gap between visualizing and acting on data was the central theme of the panel “Predict, Prevent, Optimize: Real Results from Augmented Industrial Data”. The discussion brought together four experts with deep roots in manufacturing and industrial data:
- Benjamin Corbett, Solutions Engineer, InfluxData
- Helena Jochberger, Vice President & Global Industry Lead, Manufacturing, CGI
- Omid Givehchi, CTO Susteco, Bosch
- Jan Burian, Head of Industry Insights, Trask
Together, they tackled a series of questions manufacturers are wrestling with: how to move from dashboards to predictive action, how to measure ROI in a competitive global market, and how to integrate augmented data into existing systems without risking downtime.
How Do Manufacturers Move From Dashboards to Prediction?
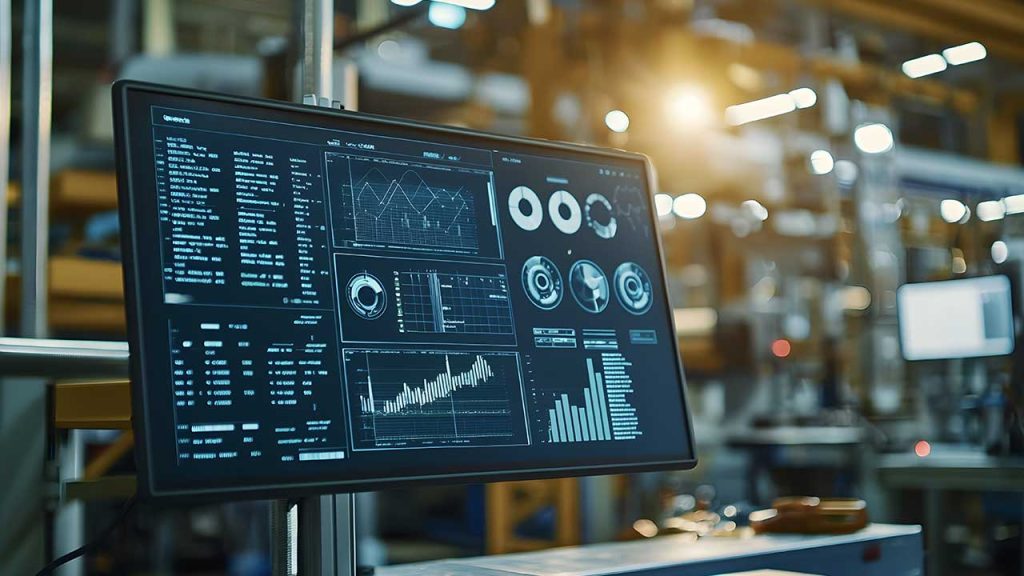
Most manufacturing dashboards are reactive: a pump only triggers an alarm after vibration exceeds a threshold, by which point failure is already inevitable. Moving to predictive action means catching weak signals, including micro-vibrations, slight temperature rises, and subtle lubrication changes, long before any alarm sounds. This requires industrial-grade time-series databases and open, interoperable data formats.
Question: Many plants collect vast amounts of time-series and contextual data, but struggle to translate it into timely, actionable decisions. What proven methods or tools help manufacturers move from simply visualizing augmented data to actually driving predictive and preventive actions on the plant floor?
Most dashboards today remain reactive. A pump only trips an alarm when vibration exceeds a threshold, by which point failure is already inevitable. The opportunity is in catching weak signals — micro-vibrations, slight temperature rises, subtle lubrication changes — long before alarms sound.
Achieving this requires the right infrastructure: industrial-grade time-series databases and open formats that make contextualization possible. Proprietary “walled gardens” might look polished, but they trap data and slow innovation. Predictive foresight depends on flexible, interoperable foundations.
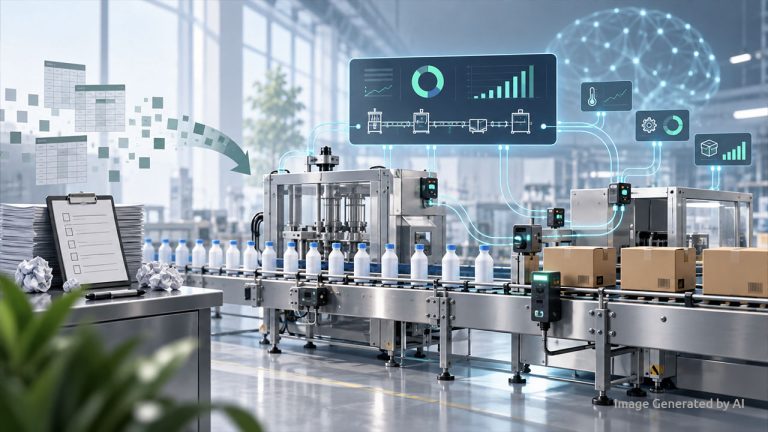
Strategic Roadmap: Intelligent Systems Maturity: Transitioning from Monitoring to Automated Prevention
What KPIs Measure ROI for Predictive Manufacturing?
ROI for augmented industrial data is not a slide deck of KPIs. According to the panel experts, the most meaningful measures are whether predictive approaches keep a factory competitive by cutting downtime, reducing scrap, and preventing stoppages, especially when global rivals can undercut on labor or energy costs. Management typically expects measurable results within 12 to 18 months.
Question: When augmented data is used to detect hidden patterns, improve load balancing, or reduce manual intervention, what metrics or KPIs are most effective for quantifying ROI — and how quickly can manufacturers expect measurable improvements?
This is where many pilots collapse. Without standardized, contextualized data, companies struggle to demonstrate results within the 12–18 months management usually expects.
But ROI in manufacturing isn’t a slide deck of KPIs. It’s about whether predictive approaches keep a factory competitive. Cutting downtime, reducing scrap, and preventing stoppages matter most when global rivals can undercut on labor or energy costs.
Ownership is critical here. ROI cannot sit with IT alone. Unless IT, OT, and business leaders are aligned, even accurate metrics won’t translate into meaningful decisions.
Related Analysis: Quantifying the Hidden Financial Impact of Poor Data Quality in Manufacturing
How Do You Integrate Predictive Data Without Downtime?
Integrating augmented data layers into existing manufacturing systems does not require replacing proven OT infrastructure. One food producer solved costly chocolate-mold stoppages by combining time-series signals with recipe and environmental context, identifying the overlapping conditions causing failures without retraining operators or ripping out existing systems. The model is to overlay smarter analytics onto infrastructure already in place.
Question: What are some real-world examples of integrating augmented data layers — historical, metadata, and real-time — into existing systems in a way that minimizes downtime and operator retraining?
One food producer faced costly downtime when chocolate stuck in molds. Failures were rare, but each stoppage meant a lost day of production. By combining time-series signals with recipe and environmental context, engineers identified the overlapping conditions that caused the problem.
The fix didn’t require ripping out OT systems or retraining operators. It came from layering smarter analytics onto the infrastructure already in place. This is the model manufacturers should follow: overlay augmented data onto proven systems, minimize disruption, and build trust with operators who depend on stable processes.
What Connects Prediction, ROI, and Integration?
A single principle connects predictive action, meaningful ROI, and safe integration: manufacturers need foresight, not more graphs. Predictive signals replace static alarms, ROI measures competitiveness rather than just cost savings, and integration strategies protect uptime and operator trust. The time-series database sits at the foundation of all three, purpose-built for the velocity, volume, and precision industrial environments demand.
Each of these questions ties back to a single truth: manufacturers don’t need more graphs; they need foresight. Predictive signals instead of static alarms. ROI that measures competitiveness, not just cost savings. Integration strategies that protect uptime and operator trust.
And at the foundation of it all sits the time-series database — purpose-built to handle the velocity, volume, and precision that industrial environments demand. Without the right database infrastructure to capture, contextualize, and query machine data at scale, even the most sophisticated predictive models remain theoretical. The path from reactive dashboards to proactive foresight begins with getting the data foundation right.
Technical Deep Dive: The Role of Time-Series Data in Modern Manufacturing Infrastructure
FAQ
1. Why do manufacturing dashboards fail to prevent equipment failures?
Manufacturing dashboards typically operate reactively: alarms only trigger after a variable, such as vibration or temperature, exceeds a preset threshold. By that point, failure is already inevitable. Preventing failures requires detecting weak signals, including micro-vibrations and subtle lubrication changes, far earlier. This is the core limitation that panel experts from InfluxData, CGI, Bosch, and Trask identified in the “Predict, Prevent, Optimize” discussion.
2. What role does a time-series database play in predictive manufacturing?
A time-series database is purpose-built to handle the velocity, volume, and precision that industrial environments require. It captures, contextualizes, and queries machine data at scale, making it possible to detect patterns across historical, metadata, and real-time data layers. Without this foundation, even sophisticated predictive models remain theoretical. The panel identified it as the core infrastructure supporting the shift from reactive dashboards to proactive foresight.
3. Predictive manufacturing vs. reactive monitoring: what is the practical difference?
Reactive monitoring waits for a metric to breach a threshold before alerting operators, often too late to prevent a stoppage. Predictive manufacturing uses industrial time-series data to detect weak signals, such as micro-vibrations or slight temperature changes, before failure becomes inevitable. The panel cited a food producer that identified overlapping conditions causing chocolate-mold stoppages by combining time-series signals with recipe and environmental context, without replacing any existing systems.
4. Why must IT, OT, and business leaders align for predictive manufacturing ROI?
Ownership of ROI is critical in predictive manufacturing. Panel experts, including Helena Jochberger of CGI and Jan Burian of Trask, warned that unless IT, OT, and business leaders are aligned, even accurate metrics will not translate into meaningful decisions. Without standardized, contextualized data shared across all three groups, companies struggle to demonstrate results within the 12 to 18 months that management typically expects from industrial data investments.
Related Reading
AI Agents in MES: Beyond the Chatbot